

2C. Supply Curve
Entities (Part 1)
- Entities are suppliers, sellers, producers, or
firms.
Horizontal Interpretation (Part 2)
Quantity Supplied (Part 2A)
- The quantity supplied is the actual amount of a
good or service people are willing to some specific price.
- The supply schedule shows the quantity supplied
depends on the price. The supply curve illustrates this relationship.
- The supply schedule shows the quantity supplied at
each price and is represented graphically by a supply curve. Supply
curves usually slope upward.
Supply Schedule vs. Supply Curve (Part 2B, Photo
by Higher Rock Education)
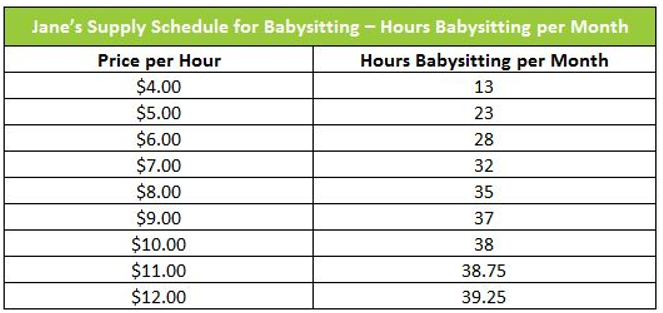
- A supply schedule shows how much of a good or
service would be supplied at different prices.
- A supply curve shows the relationship between
quantity supplied and price.
- An individual supply curve illustrates the
relationship between quantity supplied and price for an individual producer.
- The market supply curve is the horizontal sum of the individual
supply curves of all producers in the market.
- The supply schedule shows the quantity supplied
at each price and is represented graphically by a supply curve. Supply
curves usually slope upward.
- The market supply curve for a good or service is the horizontal sum of the individual supply curves of all producers in the
market.
Law of Supply (Part 2C)
- The law of supply states that an increase in price
results in an increase in quantity supplied.
Derivation of Market Supply Curve from Individual Supply
Curves (Part 2D, Photo by ResearchGate)

- To derive a market supply curve, we have to add the
supplies of all the producers of a product.
- Thus, the market supply of a good is the sum of
quantities of that good the individual firms are willing to offer for sale at a
given time period.
- The market supply is derived simply by adding the
quantities supplied at each price by the two producers.
- The market supply curve shows how the combined
total quantity supplied by all individual producers in the market depends on
the market price of that good.
Vertical Interpretation (Part 3)
Marginal Cost (Part 3A)
- Marginal cost is the additional cost incurred by
producing one more unit of a good or service.
- Marginal Costs = MC = seller’s cost = supplier’s cost.
- Marginal Cost = dollar value of what is given up producing
the marginal (last, next) unit.
- Marginal Cost = opportunity cost of producing that
additional unit.
- “Marginal Opportunity Cost” = minimum price at
which the supplier is willing to sell the unit.
Law of Increasing Marginal Cost (Part 3B)
- Law of Increasing Marginal Cost: Production of a
good or service has increasing marginal cost when each additional unit
costs more to produce than the previous one.
Formulas (Part 3C-3G)
- At any Quantity (Q), Marginal Cost (MC) curve shows
Marginal Cost of last unit.
- Producer (P) net gain from ith unit = Price –
Marginal Costi
- Producer surplus (or profit) = Sum (Price – Marginal Costi)
= Sum (Price – Quantityi)
- Decision Rule: Given Price, select Quantity to maximize
Producer Surplus -> Quantity at Price = Marginal Cost
- Marginal Cost curve is supply curve, given rational behavior
(maximize Producer Surplus), law of increasing cost, parametric behavior with
respect to price.
- Supply Curve is Marginal Cost curve: height of Supply
Curve is Marginal Cost of that unit.
- There are both individual and market marginal cost curves.
- The marginal cost has an effect on the Producer Surplus of
change in price.
Vocabulary
- The demand curve for a good is determined by each
potential consumer’s willingness to pay.
- Individual Consumer Surplus is the net gain an
individual consumer gets from buying a good.
- The total consumer surplus in a given market is
equal to the area below the market demand curve but above the price.
- A fall in the price of a good increases consumer
surplus through two channels: (1) a gain to consumers who would have bought
at the original price and (2) a gain to consumers who are persuaded to buy by
the lower price. A rise in the price of a good reduces consumer surplus in a
similar fashion.
- A seller’s cost is the lowest price at which he or
she is willing to sell a good.
- The supply curve for a good is determined by the cost
of each seller.
- The difference between the price and cost is the seller’s individual
consumer surplus.
- The total producer surplus is equal to the area
above the market supply curve but below the price.
- The cost of each potential producer, the lowest
price at which he or she is willing to supply a unit of a particular good,
determines the supply curve.
- The term producer surplus is often used to refer to
both individual and total producer surplus.
Producer Surplus (Photo by EconomicsHelp)
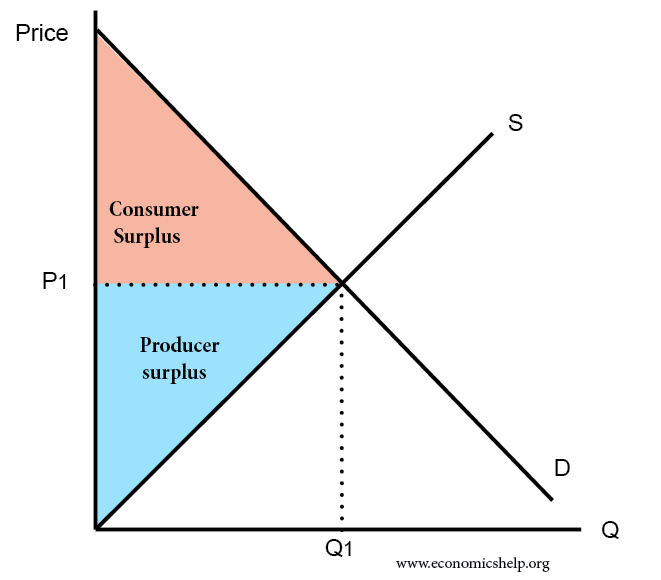
- Individual producer surplus is the net gain to an
individual seller from selling a good. It is equal to the difference between
the price received and the seller’s cost.
- Total producer surplus is the sum of the individual
producer surpluses of all of the sellers of a good in a market.
- Economists use the term producer surplus to refer
both individual and to total producer surplus.
- The total producer surplus from sales of a good at a given
price is the area above the supply curve but below the price.
Shifts of Supply Curve (Part 4, Photo by CourseHero)
Shift of the Supply Curve (Part 4A)

- A shift of the supply curve is a change in the
quantity supplied of a good or service at any given price. It is represented by
the change of the original supply curve to a new position, denoted by a new
supply curve.
- A movement along the supply curve is a change in
the quantity supplied of a good arising from a change in the good’s price.
Outward, Right, Downward vs. Inward, Leftward, Upward
(Part 4B)
- A rightward shift of the supply curve means at any
given price; producers supply a larger quantity of the good than before.
- A leftward shift of the supply curve means
at any given price; producers supply a smaller quantity of the good than
before.
- An input is a good or service that is used to
produce another good or service.
- Increases or decrease in supply lead to shifts of the
supply curve. An increase in supply is a rightward shift: the quantity
supplied rises for any given price. A decrease in supply is a leftward shift:
the quantity supplied falls for any given price.
Shift Due to Change in Marginal Cost versus Other Reason
(Part 4C)
- Shifts of the supply curve dis a change in the
quantity supplied at any given price.
Causes in Shift (Part 4D)
- The five main factors that shift the supply curve are:
(1) A change in input prices
(2) A change in the prices of related goods and services
(3) A change in technology
(4) A change in expectations
(5) A change in the number of producers